Dashboard
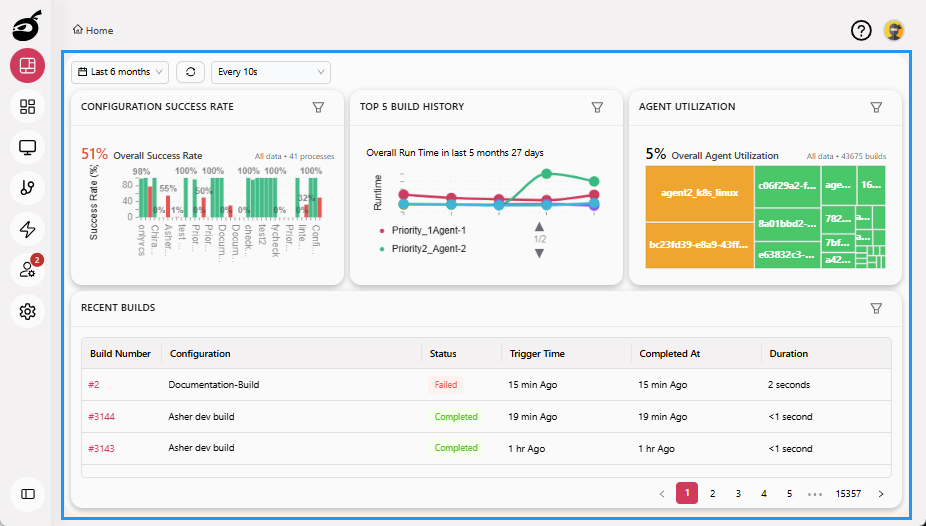
Dashboard ![]() provides a centralized summary of BuildNinja's current state. It offers real-time indicators that help you monitor overall system and project performance at a glance.
provides a centralized summary of BuildNinja's current state. It offers real-time indicators that help you monitor overall system and project performance at a glance.
Dashboard Controls
Time Range Filter
Customize the data shown on the dashboard by selecting a predefined time range:
- Last 24 hours
- Last 7 days (Week)
- Last 30 days (Month)
- Last 90 days (Quarter)
- Last 6 months
- Last 1 year
- Last 3 years
Refresh Options
- Manual Refresh: Click Refresh button to instantly update the dashboard with the latest data.
- Auto Refresh: Enable or disable auto-refresh with the following interval options:
- Every 10 seconds
- Every 30 seconds
- Every 1 minute
- Every 5 minutes
- Select Auto Refresh: Off to disable automatic updates
Key Metrics
The dashboard provides detailed metrics and filters to help you assess and optimize your CI/CD builds:
- Configuration Success Rate: See the percentage of successful builds for each configuration.
- Top 5 Build History: Highlights the five most recent builds with their outcomes.
- Agent Utilization: Understand how efficiently your build agents are being used over time.
Recent Builds
The Recent Builds section displays the latest build activity across your projects. Each entry includes:
| Field | Description |
|---|---|
| Build Number | Unique identifier for the build |
| Configuration | The associated build configuration |
| Status | Build result |
| Trigger Time | When the build is scheduled to run on the agent; it includes the queue time also |
| Completed At | When the build finished |
| Duration | Total time the build took to complete |
This table helps you quickly identify build status and troubleshoot issues when needed.