Customize Dashboard View
The Dashboard provides real-time insights into builds and agents through key metrics. You can customize the view using controls and filters to focus on the data most relevant to you.
Dashboard Controls
BuildNinja provides intuitive dashboard controls that allow you to fine-tune how data is presented. These controls help you view relevant data in real-time or over specific time periods, ensuring better monitoring and decision-making.
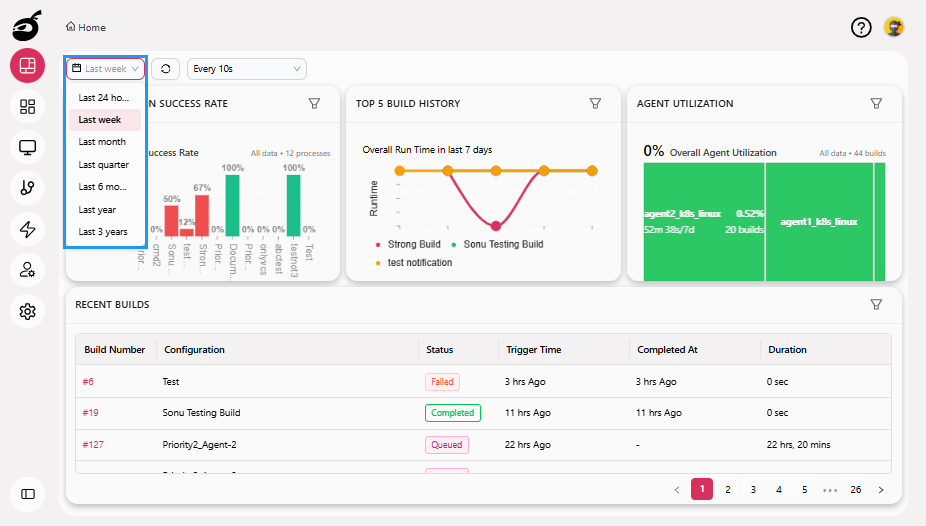
Time Range Filter
Use the Time Range Filter to customize the dashboard view based on a specific time window. This enables performance and trend analysis over meaningful time intervals. You can choose from the following predefined ranges:
- Last 24 hours
- Last 7 days (Week)
- Last 30 days (Month)
- Last 90 days (Quarter)
- Last 6 months
- Last 1 year
- Last 3 years
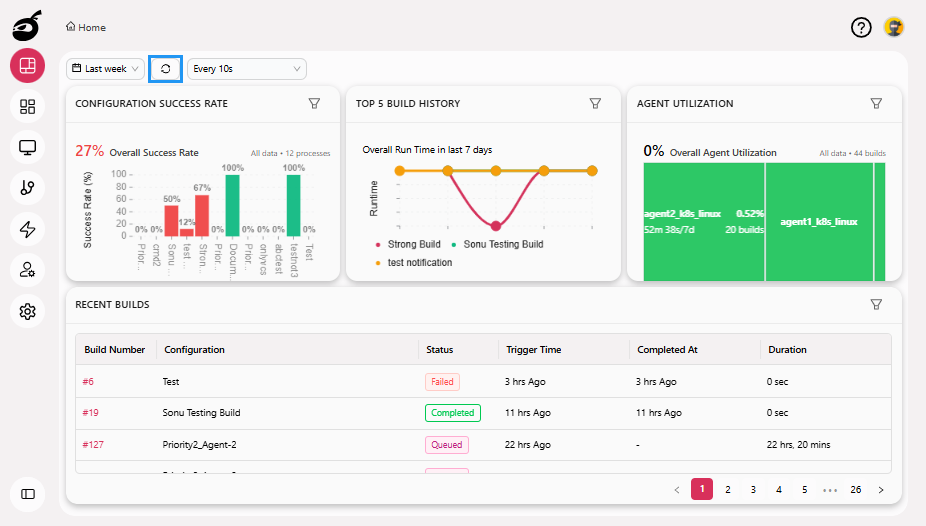
Refresh Options
Keep your dashboard up to date with manual or automatic refresh options:
-
Manual Refresh: Click Refresh button to instantly reload the dashboard with the latest data.
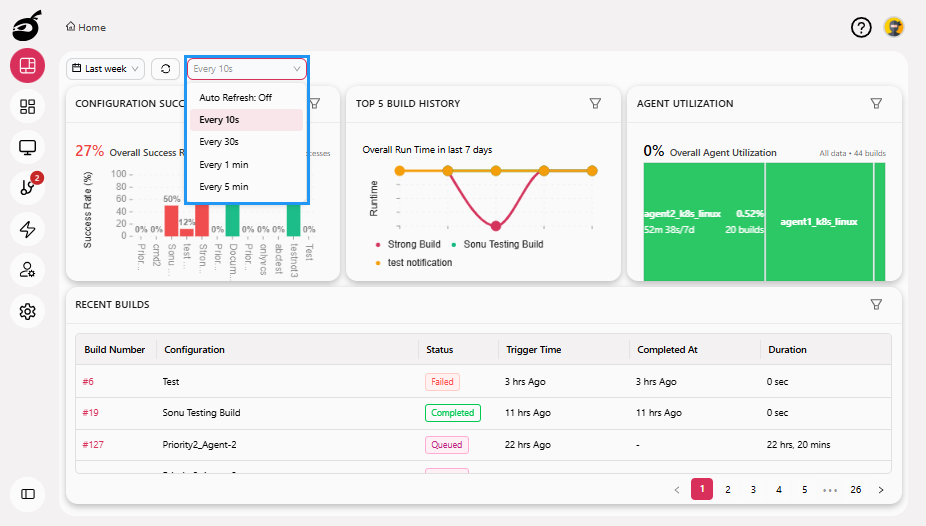
-
Auto Refresh: Choose how often the dashboard should update automatically:
- Every 10 seconds
- Every 30 seconds
- Every 1 minute
- Every 5 minutes
- To disable automatic updates, select Auto Refresh: Off.
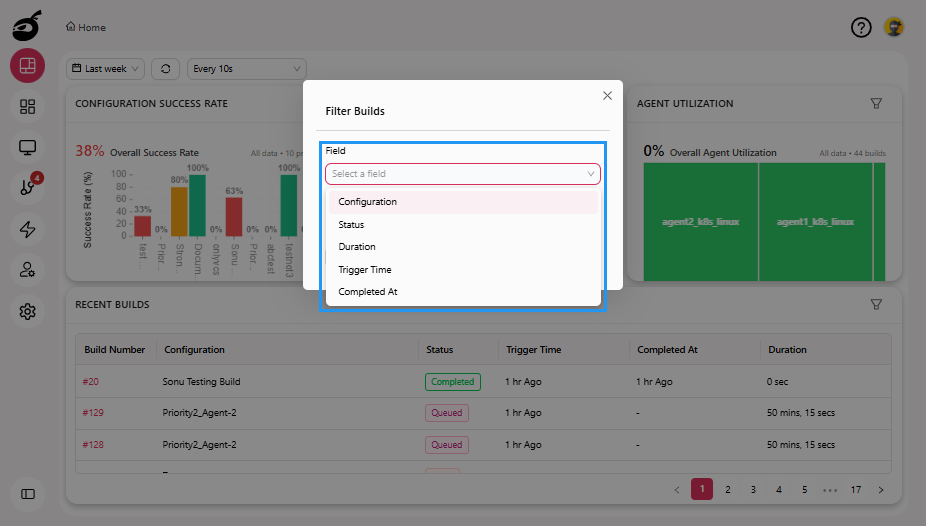
Filter Key Metrics and Recent Builds
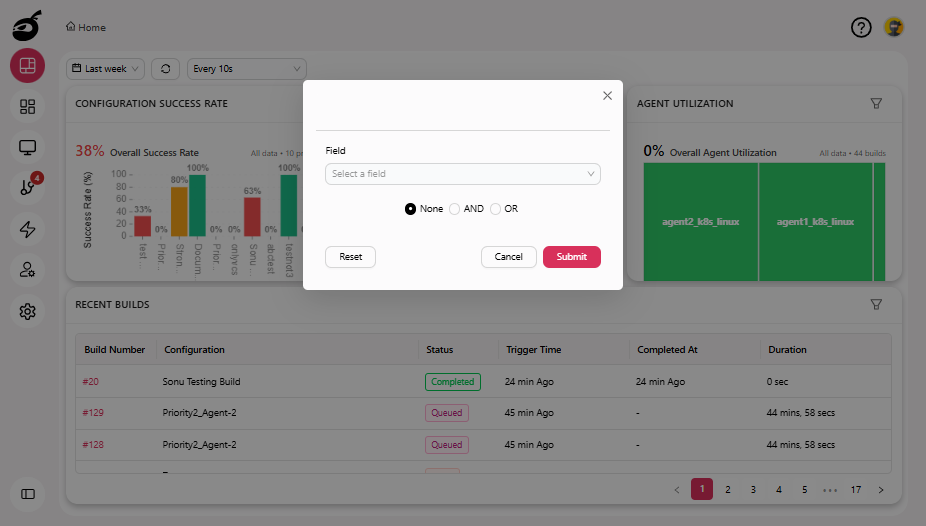
BuildNinja provides built-in filters for key metrics — Configuration Success Rate, Top 5 Build History, Agent Utilization — and Recent Builds on the dashboard. These filters enable you to quickly identify top- or bottom-performing configurations and agents. To use them, click the Filter ![]() icon that appears on each metric and on Recent Builds. Each filter includes the following controls:
icon that appears on each metric and on Recent Builds. Each filter includes the following controls:
- Field: Choose the data field you want to filter.
- None / And / Or: Define how multiple conditions are combined.
- None: No filter is applied.
- And: Only results matching all selected conditions are displayed.
- Or: Results matching any selected condition are displayed.
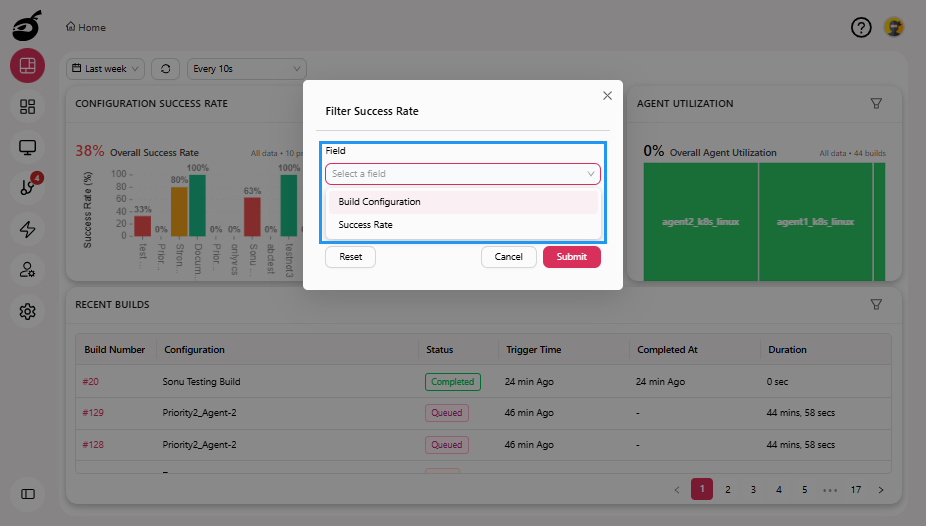
Configuration Success Rate
Filter the Configuration Success Rate metric using the following fields:
- Build Configuration: Select specific build configurations.
- Success Rate: Filter by the percentage of successful builds.
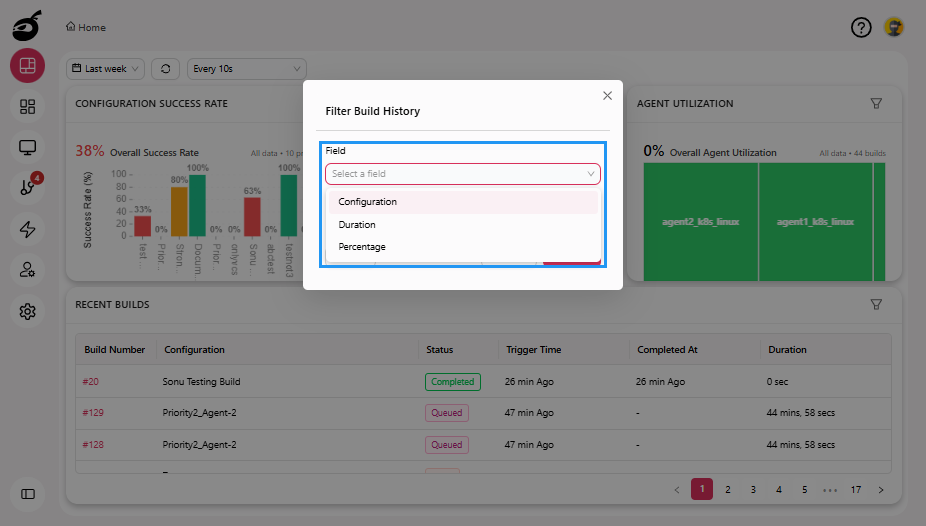
Top 5 Build History
Filter the Top 5 Build History metric using the following fields:
- Configuration: Select specific build configurations.
- Duration: Filter based on how long builds take to complete.
- Percentage: Filter based on build success rate.
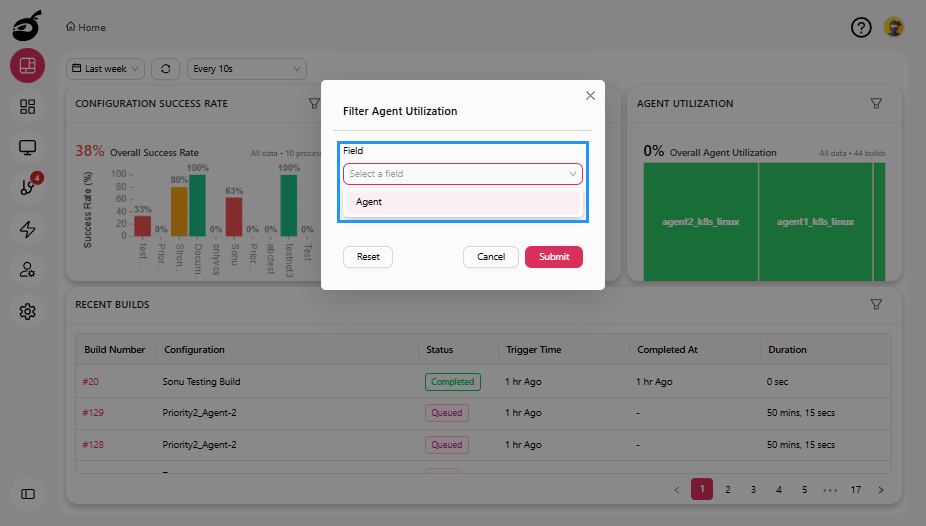
Agent Utilization
Filter the Agent Utilization metric using the following field:
- Agent: Select one or more agents to monitor utilization.
Recent Builds
Filter the Recent Builds section using the following fields:
- Configuration: Select specific build configurations.
- Status: Filter by build status (such as Completed, Failed, etc.).
- Duration: Filter by how long a build took to complete.
- Trigger Time: Filter by when the build was triggered.
- Completed At: Filter by when the build finished.